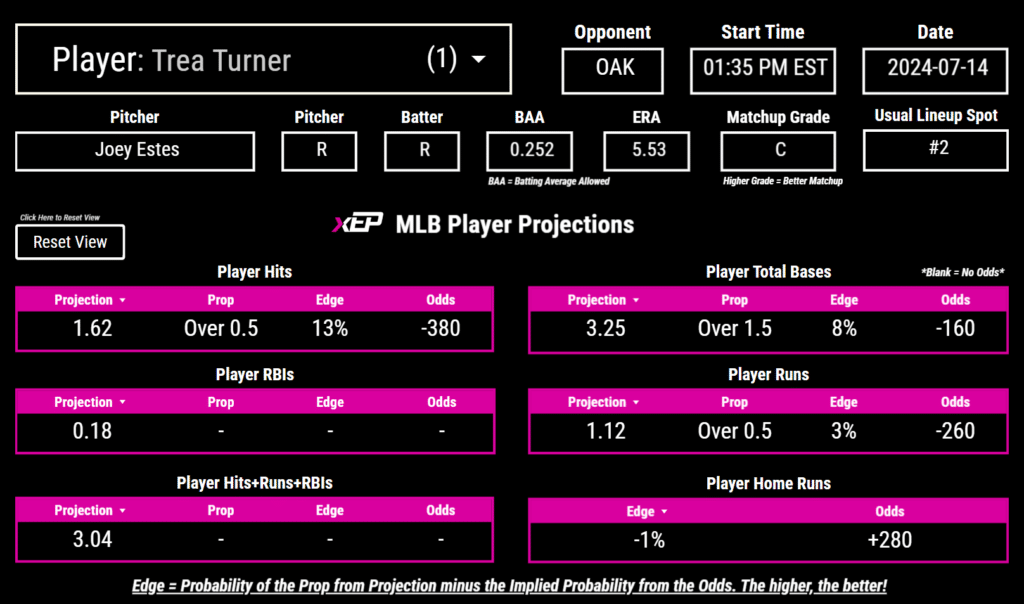
The Date on each dashboard showcases what date the projections are for. Make sure that the date is today or else that means the data is old. Daily projections are uploaded daily around 10am EST.
MLB Player Data can be seen through three different data tools. By Player Name, Matchup and Market. Projections are broken apart into prop markets. Defining each column:
What if the Prop, Edge and Odds are blank? If they are blank, that means that the prop and odds were not available at the time projections were ran. Currently, projections are run once a day.


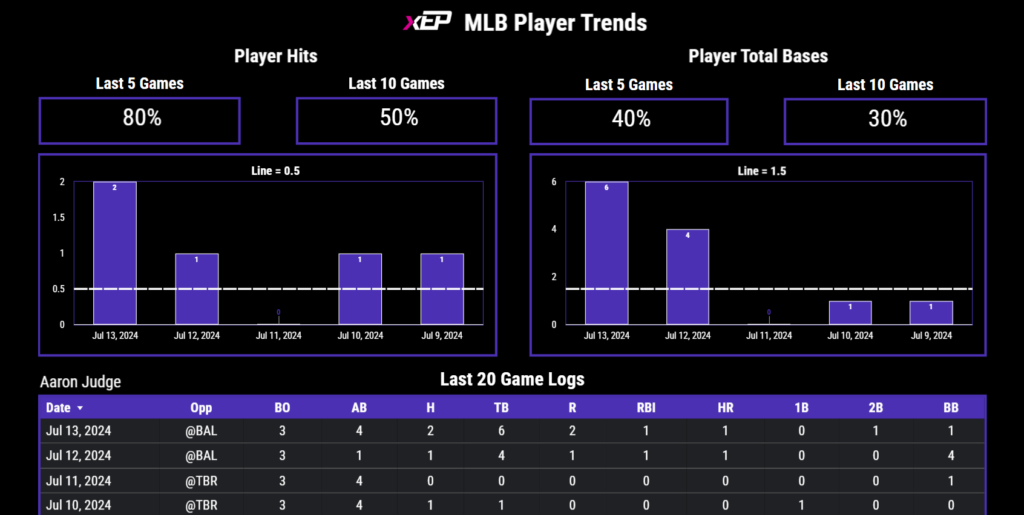
Apart of the MLB Player Data dashboard are the Player Trends. Currently, we offer trends for Player Hits and Player Total Bases. You can see the players trends for the last 5 and 10 games.
You can also us the game logs tool which will show you individual game logs for the player over the last 20 games. Feel free to sort by any column by clicking on it!